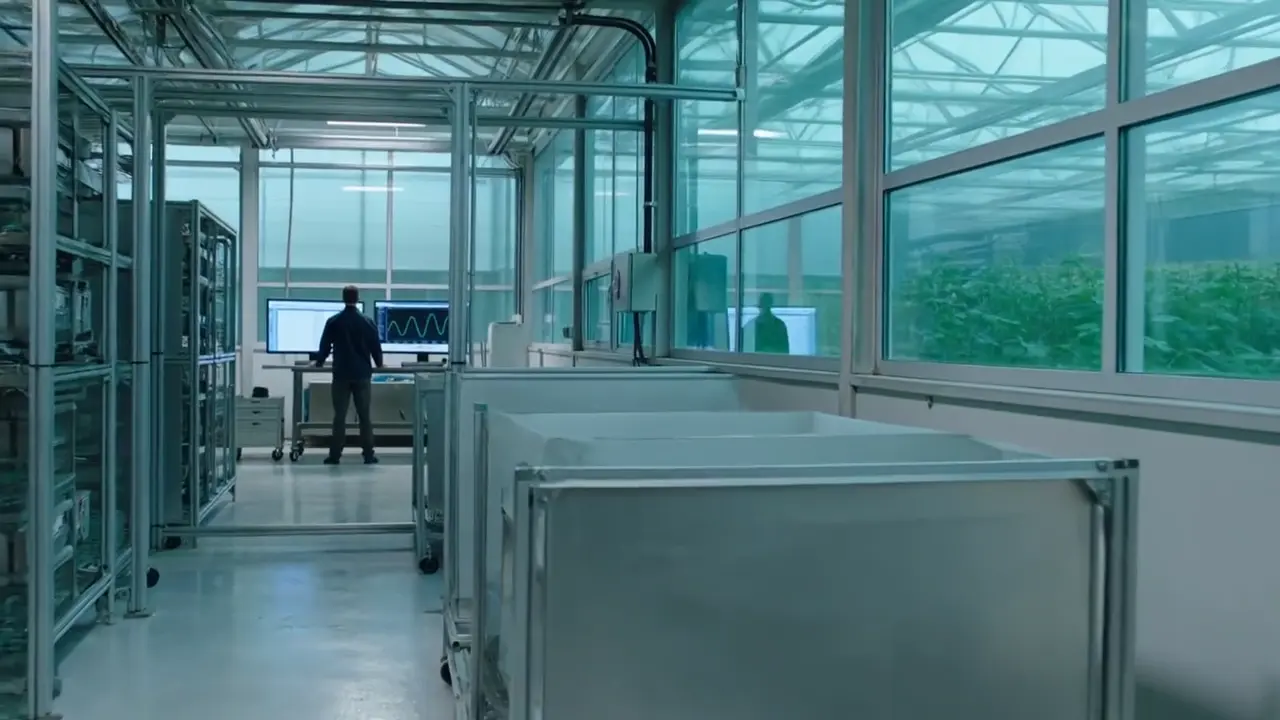
Applied technology for growing, packing, logistics and infrastructure. Explore the workflows, monitoring specifications and automation pilots you can discuss with Forem Labs.
I'm Mateo, your guide to FFM.CO. FOREM Labs is the applied technology and automation side of the business. We're looking at practical workflows: greenhouse alerts, harvest planning, cold-chain exceptions, and equipment supervision. The offer begins with workflow design, monitoring specifications, and a carefully scoped pilot. The examples here are proposed applications, not completed installations. Explore how a decision moves from evidence to recommendation, with accountable people, tested limits, and independent equipment safeguards before any physical automation.
FROM A QUESTION TO A WORKING MODULE
What could one useful upgrade do?
Choose greenhouse monitoring, a packing handoff, storage alerts or a crop-camera pilot. Inspect the parts, include the in-house work and test the value with your own assumptions. Carry the complete scenario into a project brief.
Start with the Forem Greenhouse Harvester, designed by Michael Forem. See a full pick in 3D, then explore the supporting Sensor Scout, crop-camera and vent-motion projects.
The applied-technology and automation arm of Forem, focused on the decisions behind growing, packing, logistics and infrastructure.
The product or service
Workflow design, monitoring and automation projects built around your operation.
Who it serves
Growers, packers and infrastructure operators who need to connect equipment, records and accountable decisions.
Use cases
Practical ways to apply the products, services and technology to your operation.
01
Greenhouse exception monitoring
An operator needs to know which growing zone needs attention and why.
The scope
A pilot can combine climate, irrigation and operator records into a zone-by-zone exception view, with alert thresholds, acknowledgement and an action history. Local equipment safeties remain independent.
Bring to the conversation
Site layout, existing controllers, sensor list, data access and the person responsible for approving changes.
02
Harvest-to-pack planning
A packhouse needs to compare expected grape-tomato harvest with orders and available packaging.
The scope
A planning workflow can reconcile forecast harvest, quality grades, pack formats and labor requirements, then flag shortages for a supervisor. Compare planned and actual packout rather than promising a yield increase.
Bring to the conversation
Harvest logs, order format, pack specifications, labor shifts and how rejected product is recorded.
03
Cold-chain exception review
A dispatcher needs to investigate a late truck or a temperature excursion without searching several systems.
The scope
A pilot can assemble shipment, lot, temperature and receiving events into one exception timeline. An operator decides disposition; the software does not automatically release food or certify safety.
Bring to the conversation
Carrier data access, logger format, receiving windows, product-specific handling requirements and escalation contacts.
04
Equipment and energy supervision
A facility operator needs to distinguish an equipment fault from a temporary load or cooling change.
The scope
A monitoring specification can connect power, thermal and maintenance records, define alert ownership and compare energy per operating unit. Any automatic action requires tested limits and human authorization.
Bring to the conversation
Electrical and cooling diagrams, equipment models, meter intervals, maintenance records and access permissions.
Forem Labs / TOMATO RESEARCH
What becomes saleable. What becomes revenue.
A short numbers segment for one harvest window. Play the sequence or choose a step.
01 / Harvested5,000 kg
1,000 productive plants × 0.25 kg per plant per week × 20 harvest weeks.
Editable demonstration assumptions, not measured Forem or Maguana results. Starting scenario: 5,000 kg harvested → 4,250 kg saleable → 3,825 kg sold → $11,475 revenue. With the stated costs, the operating result is $1,280. Revenue is calculated from sold volume. Financing, taxes and capital purchases are excluded unless entered in the detailed model.
Inspect and change the full cost model
The full model uses the same assumptions as the short segment. Edit labor, energy, crop inputs, packing, delivery and allocated costs here.
03 / GRAPE TOMATO ECONOMICS
From plants to packs. Then to the result.
Start with your crop records. Yield, saleable quality, sell-through and the full cost of one harvest window determine the scenario.
All starting numbers below are editable demonstration assumptions—not measured Maguana yields, wages, tariffs or results. The model also works for other tomato types when you enter their own yield and pack specifications.
Harvested5,000 kgMarketable4,250 kgSold3,825 kg
750 kg nonmarketable · 425 kg marketable but unsold
15,300 sold-pack equivalents at 250 g · Pack equivalents do not account for case rounding.
Break-even selling price$2.67 / kgBreak-even sold volume3,291.7 kgOperating margin11.2%
Revenue$11,475
Crop labor-$3,600
Energy-$300
Inputs + other-$2,000
Packing + delivery-$2,295
Contribution$3,280
Fixed costs-$2,000
Operating result$1,280
Harvest kg = plants × average kg/plant/week × harvest weeks Sold kg = harvest × packout × sell-through Revenue = sold kg × price Crop cost = labor hours × hourly cost + kWh × energy price + inputs + other Contribution = revenue − sold kg × packing/delivery cost − crop cost Operating result = contribution − fixed costs Break-even sold kg = (crop + fixed costs) ÷ (price − packing/delivery cost)
Use costs for the same crop window. Harvest weeks exclude nonharvest periods; average yield is an assumption, not constant measured weekly production. Crop labor excludes costs already entered per sold kg. Include establishment labor and energy in the window totals. Financing, taxes, capital purchases and separate disposal/storage costs are excluded unless entered under other costs. This is an illustrative operating scenario, not a complete investment model or profit forecast. Break-even volume holds entered cycle costs and unit price/cost constant.
Build your energy and computing assessment from the whole operating picture: fuel supply, generation, essential farm demand, cooling and delivered service. Use site-specific inputs for the cost model.
Fuel supply
Suitable feedstock quantity and seasonality; purchase or collection, conversion, quality testing, storage, transport and fuel losses. Use a delivered qualified-fuel cost.
Generation
Manufacturer fuel-consumption data at the intended load, fuel energy content, generation efficiency, ambient derating, auxiliary demand and electrical losses.
Available service
Hourly farm load, reserve, maintenance and outages; compute cooling, networking and storage; workload scheduling and customer utilization.
Operating costs
Generator and IT maintenance, replacement parts, labor, connectivity, insurance, monitoring, consumables and other ongoing site costs.
Capital
Fuel-production equipment if selected, storage, generator, electrical installation, cooling, IT hardware, site works and commissioning. Account separately for financing and depreciation.
Use consistent boundaries. Calculate the variable cost per net delivered kWh from the fuel chain, consumption and variable generation costs. Include auxiliaries and distribution losses. Enter that rate in the compute model below; enter fixed operating costs and installed capital separately. Cooling is included through the facility-overhead input. Avoid counting the same fuel, cooling or maintenance cost twice.
Compare this project with grid supply, contracted hosting or an appropriately sized cloud service. Use measured or manufacturer-supported operating assumptions, and credit only useful heat that replaces an actual cost. Farm electricity consumption is an operating requirement, not compute revenue.
Available power is the start. Sold work pays the bills.
Compare two separate hardware pathways. This is a transparent operating illustration, not a market quote, investment recommendation or forecast of Forem returns.
Every commercial input is a demonstration assumption. GPU reference: eight GPUs and 10.2 kW maximum system power from NVIDIA DGX H100/H200; the model’s 4 kW idle draw is an invented planning assumption, not a vendor specification. ASIC reference: BITMAIN S21 Pro 234 TH/s / 3.51 kW at stated test conditions. Neither is a selected Forem purchase. Replace all loads with measured or warranted values.
GPU count and power must describe the same fleet. Changing GPU count does not automatically rescale the power or capital inputs. Enter the active and idle load for all servers, networking and storage included in your IT boundary, plus the corresponding installed capital. The starting eight-GPU example is one reference system, not a per-GPU power figure.
720-HOUR SCENARIO / USD
Available hours
684
Billable GPU-hours
3,283.2
Facility energy
6,336.6 kWh
Gross revenue
$6,566
Pool fees
$0
Electricity
$634
Other operating costs
$1,500
Operating contribution
$4,433
Simple capital recovery
Not established
Contribution is before depreciation, financing and tax. Enter demand charges, maintenance, labor, connectivity, rent, insurance and software in other costs. No heat credit is included.
Read formulas and limitations
Available hours = period hours × availability. GPU billable hours = GPUs × available hours × utilization. GPU IT energy = active whole-system kW × active hours + idle whole-system kW × available idle hours. Mining revenue = total TH/s ÷ 1,000 × operating hours ÷ 24 × USD per PH/s-day. Facility energy = IT energy × overhead multiplier. Contribution = revenue − pool fees − electricity − other operating costs.
Mining hashprice bundles changing network, reward, fee and coin-price conditions; it is not a fixed tariff. GPU revenue requires paying customers, and utilization cannot be assumed. The electricity input does not include demand charges unless you explicitly allocate them. Outage/curtailment hours assume equipment is off; standby and restart energy require additional cost. The overhead multiplier is a planning assumption, not a measured site PUE.
Simple recovery divides entered capital by this period’s positive contribution and assumes that contribution repeats unchanged. It ignores financing, taxes, depreciation, replacements, hardware obsolescence and time value; it is not ROI. Zero capital means unknown, not free equipment. Farm-AI savings require a measured baseline and verified change in yield, labor, energy or losses; do not count a hypothetical farm benefit as compute-hosting revenue.
Collect calibrated readings and event records. Missing or unreliable input triggers an exception rather than an automatic action.
CONNECTED WORKFLOW / PEOPLE IN CONTROL
THE OPERATING PRINCIPLE
Sense the system. Reason over the evidence. Keep people in command.
AI can recommend, detect and coordinate. Physical equipment still needs local protection, limits, accountable operators and a record of every consequential change. Connect the tools and data around the decisions your team needs to make.
01 / THE PROTOCOLS
Every part has a control loop.
Select a business function to see its data, recommended action, operator approval and measurable outcome.
Maguana Tropical / growing
Proposed automation architecture
Climate & crop
01 / SENSE
Inputs
Air and leaf-zone temperature
Humidity and light
Weather forecast and crop stage
02 / REASON
Automation
Recommend vent, fan, shade and heating setpoints
Compare predicted climate with measured response
Record exceptions for the grower
03 / GOVERN
Human & safety gate
Grower approval for setpoint bounds; hard limits and manual override remain local.
MEASURE THE RESULTHours inside crop-specific target bandEnergy per growing areaAlarm response time
02 / FROM MODEL TO OPERATION
Build in layers.
Document.Map assets, owners, SOPs, site conditions and data definitions.
Instrument.Collect trustworthy sensor and event records with calibration and exception handling.
Advise.Run AI recommendations beside existing decisions; compare them with operator outcomes.
Control within limits.Automate bounded actions only after site-specific testing, human signoff and independent safeties.
Start with an operating challenge: a growing zone that needs attention, a packing forecast, a delivery exception or an energy decision. Define the inputs, responsible operator and measurable outcome, then build a focused project around them.